This article is automatically translated.

At Dwango Media Village, we conducted research on the game “Splatoon 2” released by Nintendo, and as a result, we presented “AI-based strategy analysis of regional representative teams” at the official tournament “4th Splatoon Koshien” held last year.
In this research, to analyze team strategies, we first needed to quantitatively evaluate the superiority and inferiority during the match. Splatoon is a simple yet deep game, and it is difficult to judge the superiority and inferiority by simple metrics such as the difference in paint area, making quantitative evaluation challenging. Therefore, we proposed a method to create a model that predicts wins and losses from frame images at each point in the game using streaming videos of Splatoon Koshien as training data and used it for team strategy analysis. As a result, the trained win-loss prediction model was able to predict wins and losses with about 70% accuracy throughout the 3-minute match, allowing us to apply it to team strategy analysis.
In this article, we will first explain the created win-loss prediction model and then explain how we analyzed team strategies based on the win-loss prediction model.
By creating a win-loss prediction model, it can be used for applications such as the team strategy analysis in this project, and as data for match commentators to refer to.
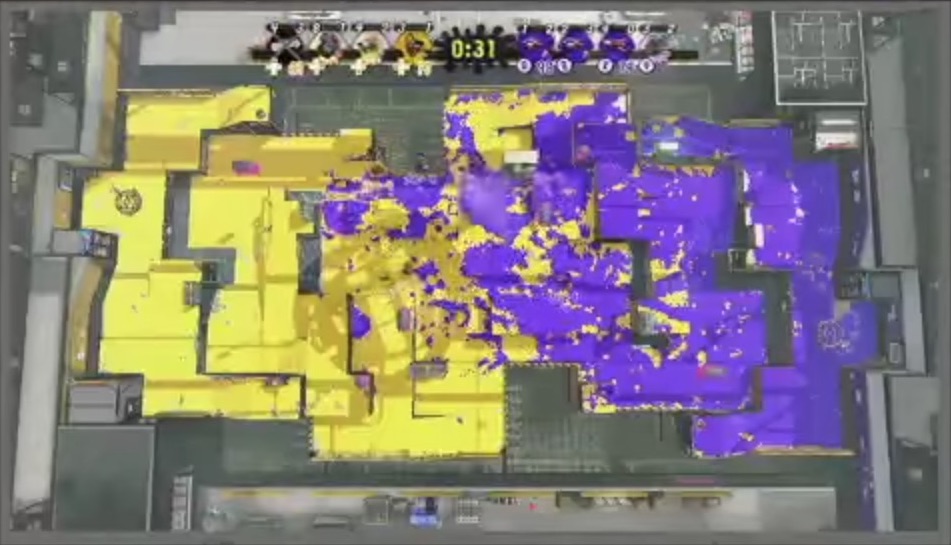
“Splatoon” is an action shooting game where two teams of four compete to paint the ground with ink. In the official tournament “Splatoon Koshien,” the “Turf War” rule is adopted, where the team that has painted more of the floor with ink after a 3-minute match wins.
Turf War has a very straightforward rule, but in high-level battles between advanced players, even players familiar with Splatoon may find it difficult to judge which team has the advantage. Specifically, it requires a comprehensive judgment based on various information such as whether advantageous positions differing by stage are secured, the difference in team strength due to the number of players, and whether “Special Weapons” that greatly influence the battle can be activated.
This “simple yet deep” aspect makes Turf War very interesting, but we thought that creating a win-loss prediction model would make the game more enjoyable.

Regarding the method for creating a win-loss prediction model, i.e., an evaluation function that calculates the goodness of a game state from the game’s situation, examples from other games can be given. In computer shogi, Bonanza [Hoki2006] successfully learned an evaluation function to calculate the goodness of a game state from the features of the game state using professional players’ game records through a supervised learning approach. In computer Go, AlphaGo [Silver2016], the predecessor to AlphaGo Zero [Silver2017], learned an evaluation function from professional human game records.
In this research, like these examples, we chose a supervised learning approach that learns an evaluation function using existing match data.
For training data, one might consider using Splatoon match videos streamed by players and their results, but using player-perspective videos has a problem. The issue is that player-perspective videos do not fully contain the game state’s information.
Therefore, we used the streaming videos of Splatoon Koshien, which provide a “bird’s-eye view map” as training data. The bird’s-eye view map includes almost all information about the game state, such as remaining time, overall paint situation of the stage, positions of all 8 players, survival status, and Special Weapons status, and thus can be used as features of the game state.
We trained a model to predict which team would win the match using bird’s-eye view map images trimmed from the streaming videos of Splatoon Koshien as input. For example, in shogi evaluation functions, there are examples of discretizing the game state by using features such as “the positional relationship between the king and two other pieces,” but in Splatoon, there is no obvious method of discretization. Therefore, we used the continuous value of the image as is and handled it with a convolutional neural network.

Training was done using transfer learning with the VGG16 [4] model. The input to the model was images cut out frame by frame from the 3-minute match video. In other words, each frame of the bird’s-eye view map was used as input, and the label “which team won the match” was used for training. The number of training data images was about 1.99 million, obtained from approximately 390 matches, excluding the semifinal and final matches of regional representative teams for evaluation and strategy analysis.
As a result of training, the accuracy of the matches used for evaluation (not used in training) was about 73%. This accuracy is a figure evaluated evenly from the start of the match to the end of the 3 minutes, where there is almost no useful information at the beginning of the match, and it can be considered that the predictions were quite accurate.
The created model outputs an evaluation value indicating the superiority or inferiority of the situation when one frame of the bird’s-eye view map image is input, and if this value is greater than 0.5, it indicates that the yellow team is advantageous, and if it is less than 0.5, it indicates that the blue team is advantageous. By inputting bird’s-eye view map images from the start to the end of the match into this model and plotting the output evaluation values, the following graph can be drawn.

By looking at the drawn graph, it is possible to analyze each match, for example, “About X seconds after the start of the match, the blue team made a breakthrough, but the yellow team quickly recovered” or “Until 30 seconds remaining, the yellow team continued to be at a disadvantage, but they made a breakthrough and won in the last 30 seconds.”
The win-loss prediction model made it possible to analyze each match’s situation, but in team strategy analysis, it was necessary to extract and visualize features common to multiple matches fought by that team. In the Turf War of tournaments like Splatoon Koshien, there are various team strategies, such as teams that dominate the enemy team from the beginning and keep them under control, teams that repeatedly try to break through with teamwork, and teams that save up Special Weapons and break through in the last 30 seconds even if they are dominated at the beginning. It was necessary to create metrics that could characterize these strategies effectively.
In this research, we calculated the transitions of evaluation values like the above figure for the semifinal and final matches of regional representative teams and calculated five metrics to represent the team’s strategy.

Early Game Strength
The results of this strategy analysis were actually published as reference data for the Splatoon Koshien team prediction project.
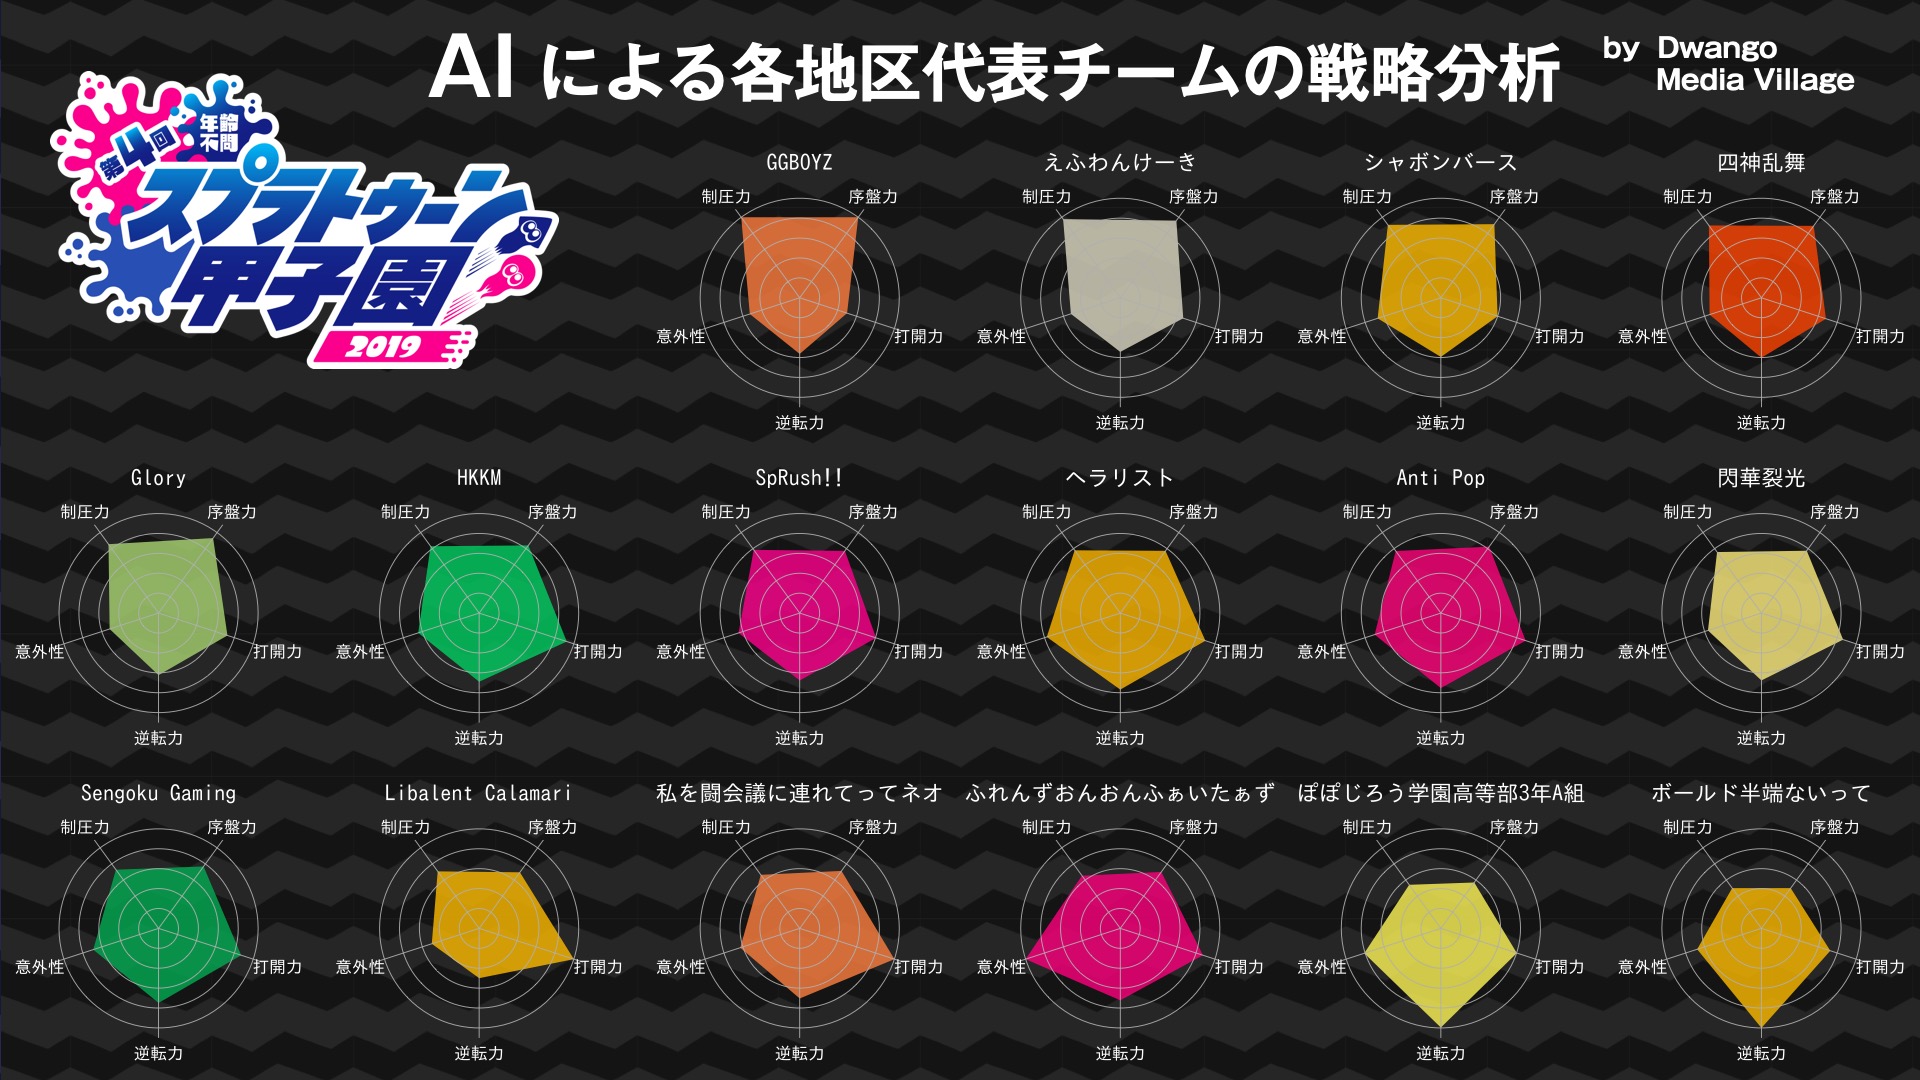
The live broadcast can be viewed here. For all 16 regional representative teams, five metrics representing the team’s strategy were calculated and visualized with radar charts.
We created a win-loss prediction model for the game Splatoon and used it to publish team strategy analysis.
Although we targeted Splatoon this time, similar methods could potentially be applied to other video game titles. Recently, the e-sportsification of competitive game titles has been actively promoted, with many high-level matches being held. By visualizing these matches from an objective perspective, it is expected that players watching can enjoy the advanced gameplay even more.
Furthermore, the created model alone can output whether one team has the advantage, but human commentators need to interpret the reason. By applying visualization methods such as Grad-CAM [Selvaraju2017], which visualizes the reasoning behind CNN decisions, it is expected to make it easier to provide explanations such as “The yellow team is evaluated as having the advantage because they secured this position.”
This research was conducted by Fujimura during his internship at Dwango Media Village. I was able to conduct research with the cooperation of DMV members for six months. Thank you very much.
Splatoon is a game I love, having played it for about 4000 hours across the series, and I was very happy to be able to contribute, albeit slightly, to the official tournament project. Finally, I would like to take this opportunity to thank everyone involved. Thank you very much.
[Hoki2006] 保木邦仁:局面評価の学習を目指した探索結果の最適制御,第 11 回ゲームプログラミングワークショップ 2006, pp. 78–83 (2006). https://ipsj.ixsq.nii.ac.jp/ej/index.php?active_action=repository_view_main_item_detail&page_id=13&block_id=8&item_id=97627&item_no=1
[Silver2017] Silver, D., Schrittwieser, J., Simonyan, K., Antonoglou, I., Huang, A., Guez, A., Hubert, T., Baker, L., Lai, M., Bolton, A., Chen, Y., Lillicrap, T., Hui, F., Sifre, L., van den Driessche, G., Graepel, T. and Hassabis, D.: Mastering the game of Go without human knowledge, Nature, Vol. 550 (online) (2017). http://dx.doi.org/10.1038/nature24270
[Silver2016] Silver, D., Huang, A., Maddison, C. J., Guez, A., Sifre, L., van den Driessche, G., Schrittwieser, J., Antonoglou, I., Panneershelvam, V., Lanctot, M., Dieleman, S., Grewe, D., Nham, J., Kalchbrenner, N., Sutskever, I., Lillicrap, T., Leach, M., Kavukcuoglu, K., Graepel, T. and Hassabis, D.: Mastering the game of Go with deep neural networks and tree search, Nature, Vol. 529 (online) (2016). http://dx.doi.org/10.1038/nature16961
[Karen2014] Karen Simonyan, Andrew Zisserman: Very Deep Convolutional Networks for Large-Scale Image Recognition. CoRR abs/1409.1556 (2014). https://arxiv.org/abs/1409.1556
[Selvaraju2017] Selvaraju, Ramprasaath R., et al. "Grad-CAM: Visual explanations from deep networks via gradient-based localization." 2017 IEEE International Conference on Computer Vision (ICCV). IEEE, 2017. https://ieeexplore.ieee.org/document/8237336
† AlphaGo Zero learned its evaluation function through self-play reinforcement learning without using any human game records.
Yutaro Fujimura