
This article is automatically translated.
Using 1.75 million images posted on Nico Nico Seiga (Illustrations), we trained a regression model to predict view counts and favorite counts using Chainer.
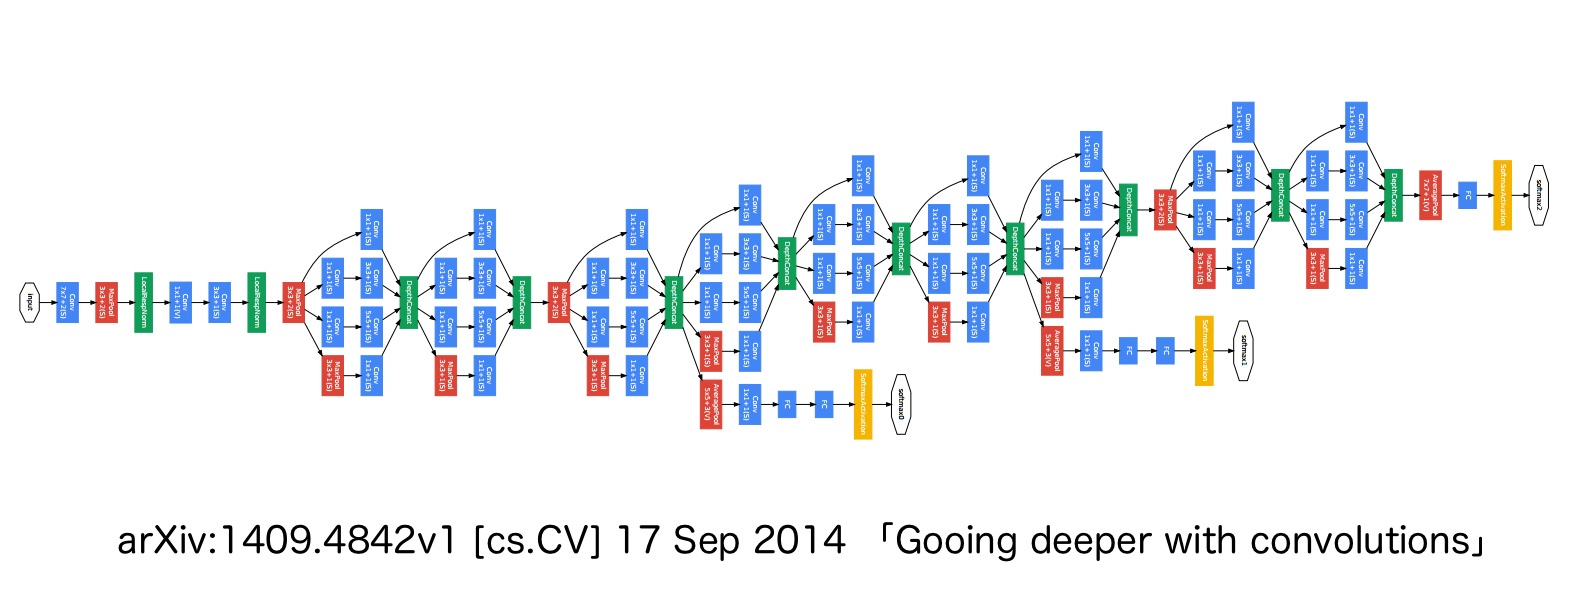
The overall structure of the model is based on GoogLeNet [1]. The structure of the original GoogLeNet is shown in the figure below.

For speed and accuracy improvements, Batch Normalization [2] is added to each layer, performing mini-batch normalization before each activation function. The original network is designed for classification problems, but we adapted it for regression by replacing the cross-entropy loss function with mean squared error.
We switched between Adam, AdaGrad, and AdaDelta optimizers randomly during training. Previous tasks showed that switching optimizers mid-training could yield accuracy comparable to using an optimally set single optimizer throughout. Chainer makes it easy to change learning dynamics like this.
While we aim to predict actual view and favorite counts, we optimized for the “mean squared error of log(view count + constant) and log(favorite count + constant).” Using the mean squared error of the raw values can disproportionately weight large view counts, making it hard to train on images with smaller view counts. By using a logarithmic scale, we effectively predict “the likely order of magnitude of view counts,” giving equal weight to predicting 100 views versus 1,000 views as predicting 1,000 views versus 10,000 views.
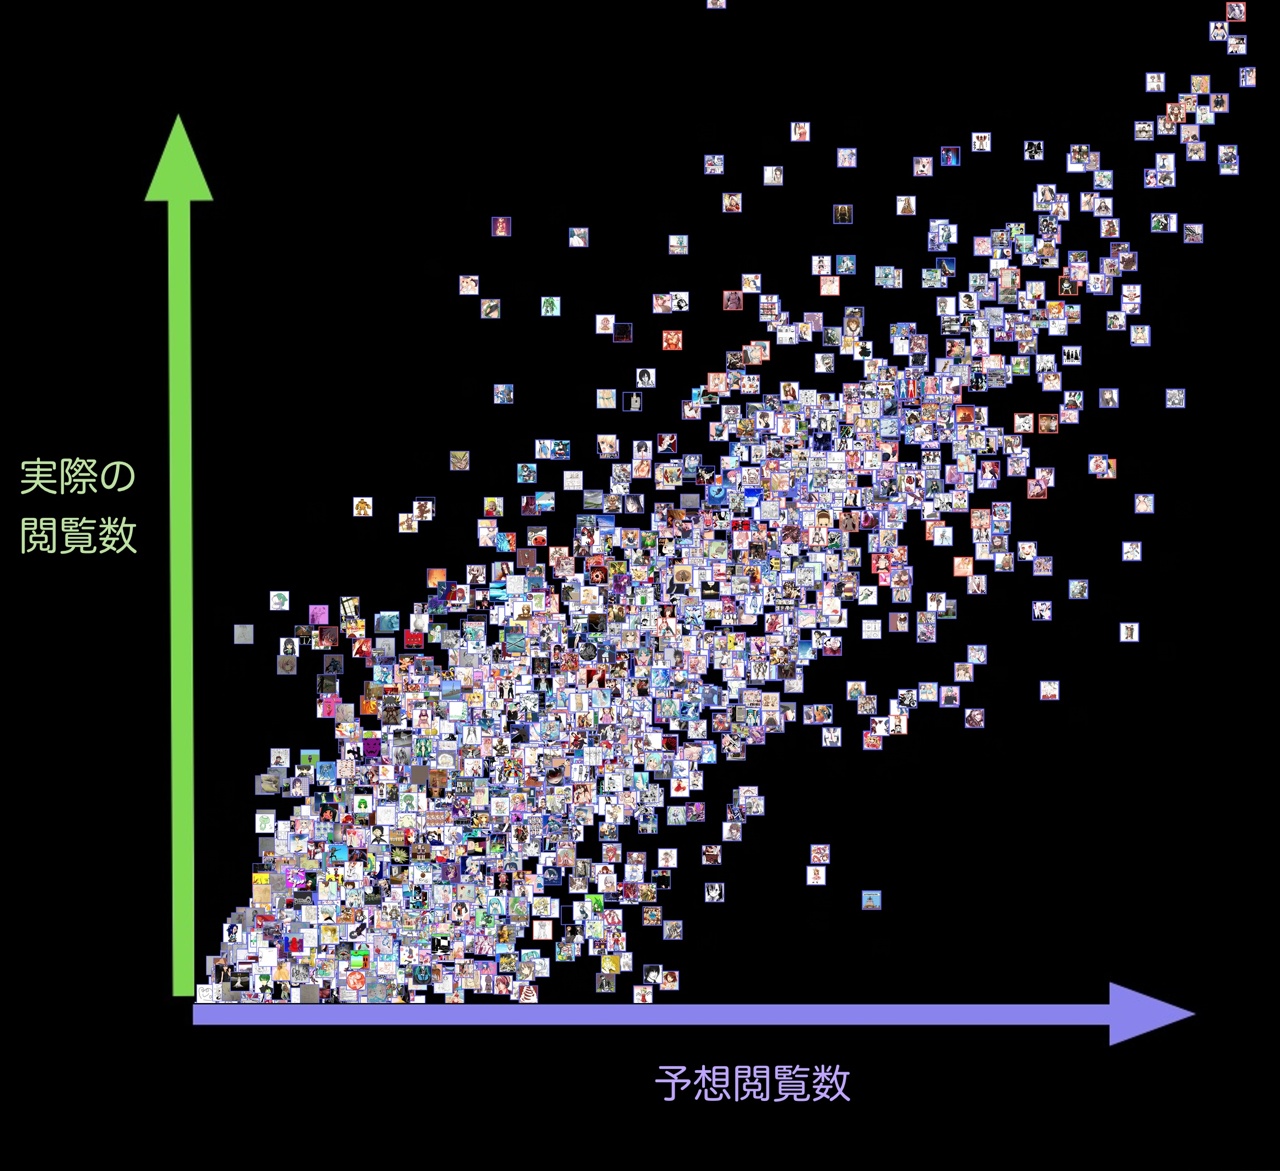
For 5,000 illustrations not used in training, we plotted the predicted and actual view counts on a log scale. Each point represents an illustration.

There are few points in the top-left and bottom-right, indicating predictions are mostly within an order of magnitude. The neural network seems reliable in not missing hit illustrations with high view counts.
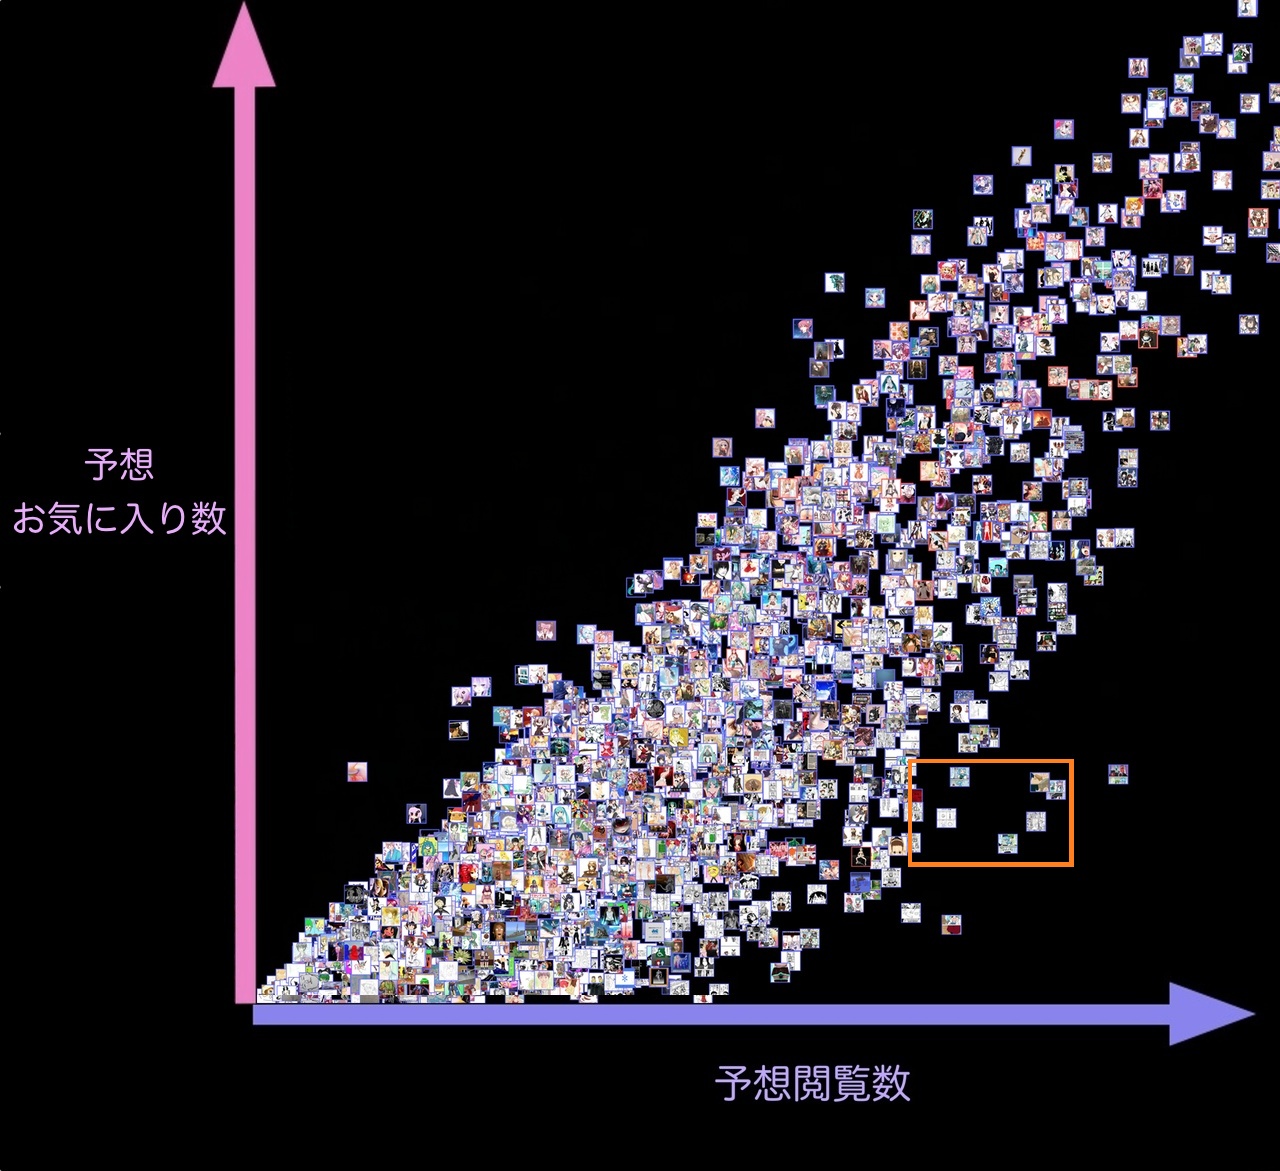
Plotting predicted view counts against predicted favorite counts gives the following result.

Predicted view counts and favorite counts do not form a perfect straight line, indicating separate evaluations for view counts and favorite counts.
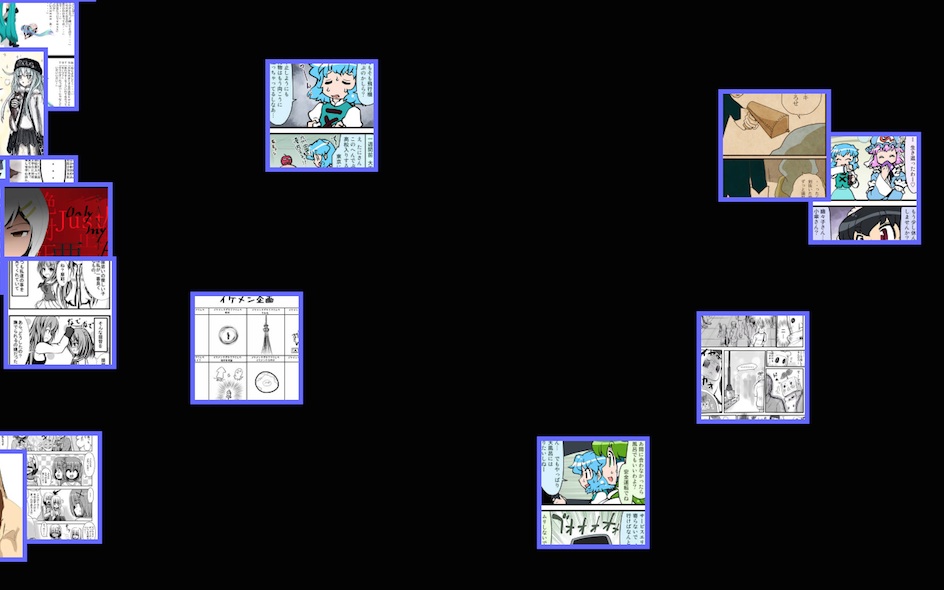
Works in comic format tend to have a high favorite-to-view ratio (as thumbnail images don’t convey text well, leading to more views). The lower right area (orange dashed range) is expanded below.

Many illustrations in this area are in comic format, indicating the model has correctly learned this trend.
“Artistic quality” is difficult to define and subjective, making direct measurement hard. Instead, we trained on “view counts/favorites,” addressing the question “how many views/favorites might this get on Nico Nico Seiga.”
While factors like tags, title exposure, SNS shares, and author name effect should influence view counts, our model learns from the image itself. The same model can identify characters/tags to some extent, indicating popular characters on Nico Nico Seiga significantly contribute to view counts. However, some original illustrations (non-fan art) also score high, suggesting the model learns concepts like “art styles likely to be popular on Nico Nico.”
This time, we only used images, not tag or title information. Incorporating these in a multimodal model could improve accuracy.
We did not consider temporal elements, but considering trending genres could improve accuracy. Predicting trends with sequence models like Long Short-Term Memory is another approach. For an online learning model in a real service, adjusting the learning rate appropriately is necessary.
This technology can support creators by predicting view and favorite counts with high accuracy before publishing illustrations, allowing them to revise their work until predicted scores are satisfactory. By dividing the image into areas and showing how each area contributes to the predicted view count, creators can identify which parts of the image need improvement. This can also help in selecting thumbnail regions likely to get higher views.
[1] Szegedy, Christian, et al. "Going deeper with convolutions." Proceedings of the IEEE conference on computer vision and pattern recognition. 2015. https://www.cv-foundation.org/openaccess/content_cvpr_2015/html/Szegedy_Going_Deeper_With_2015_CVPR_paper.html
[2] Ioffe, Sergey, and Christian Szegedy. "Batch normalization: Accelerating deep network training by reducing internal covariate shift." International conference on machine learning. pmlr, 2015. https://proceedings.mlr.press/v37/ioffe15.html